
Energy information is often split across utility meters, generators, electrical analyzers, manual fuel records, and separate facility reports. This makes it difficult to compare stations and phases, understand interval consumption, recognize abnormal electrical behavior, reconcile energy sources, and produce consistent daily or monthly evidence for operational and sustainability review.
Energy & Utilities
Energy Monitoring
Monitor electricity consumption, voltage, current, power, power factor, frequency, phases, meters, and available grid, generator, and fuel records in one dashboard.
Demo image
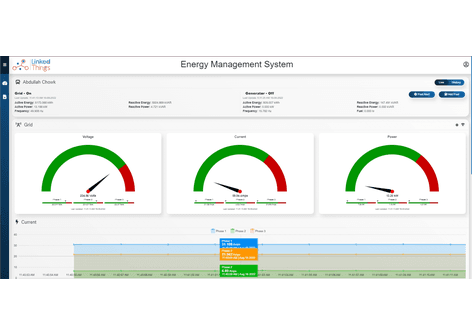
Station-level electrical view with voltage, current, and power gauges plus a selected current trend.The problem
The solution
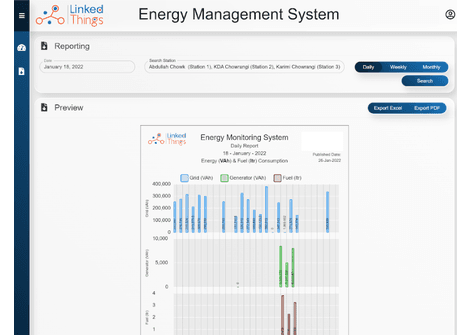
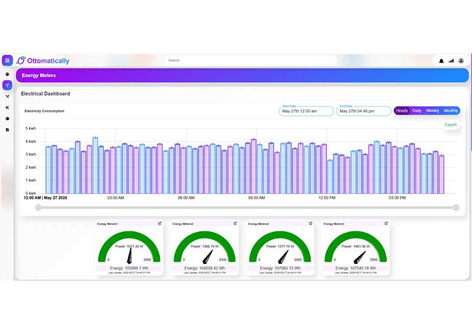
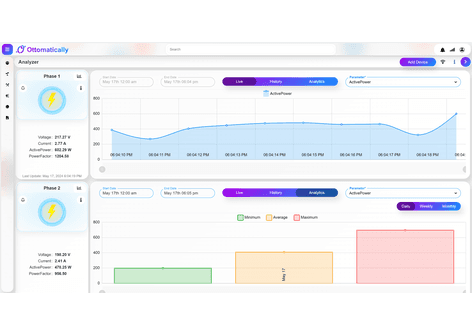
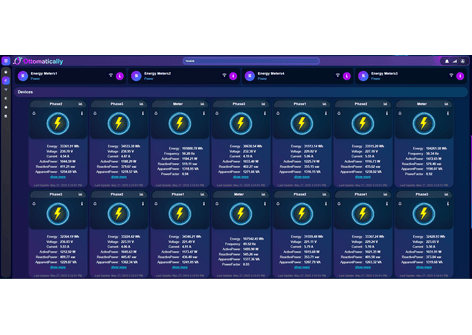
Linked Things combines available meter, analyzer, gateway, generator, and approved fuel data in live and historical dashboards. Teams can review per-device and per-phase measurements, compare voltage, current, active and apparent power, inspect power factor and frequency, analyze energy consumption over selectable periods, summarize available grid and generator contribution, and export configured reports for operational follow-up.
What it enables
Key capabilities
Multi-meter overview
View connected energy meters, analyzers, phases, and recent readings across equipment, stations, or facilities.
Live electrical measurements
Monitor supported voltage, current, active power, apparent power, power factor, frequency, and cumulative energy values.
Phase-level analysis
Inspect individual electrical phases or channels and compare their measurements and operating trends.
Consumption trends
Analyze energy use across hourly, daily, weekly, monthly, or selected reporting periods.
Minimum, average, and maximum views
Summarize selected electrical parameters to reveal operating range and potential peaks.
Energy-source reporting
Compare available grid and generator energy records and associated fuel entries when those sources are integrated.
Station and facility comparison
Filter dashboards and reports by connected station, device, source, phase, and time range.
Exportable reports
Generate configured daily, weekly, or monthly reporting views and export supported results to Excel or PDF.
Threshold and data-health alerts
Surface configured electrical exceptions, communication loss, stale readings, or meter-health conditions for review.
ESG and audit evidence
Retain traceable measurement history as an input to approved energy and sustainability calculations.
Measurement guide
Parameters explained
Available measurements depend on the connected station, installed sensors, calibration, and configured reporting standard. Units and alert thresholds should be confirmed for each deployment.
Electrical Energy
kWh
The cumulative amount of active electrical energy consumed or produced over time.
Interpretation: Compare like-for-like meter boundaries and time periods. Confirm whether a value represents import, generation, export, or a calculated interval difference.
Interval Consumption
kWh per interval
Energy used during a selected hourly, daily, weekly, monthly, or custom reporting interval.
Interpretation: Use interval data to identify peaks, baseload, schedule effects, and unusual changes. Missing or reset cumulative readings can distort calculated consumption.
Voltage
V
The electrical potential difference measured for a connected phase or circuit.
Interpretation: Review sustained high, low, or imbalanced readings against the equipment rating and site-approved electrical limits.
Current
A
The electrical current flowing through the monitored phase or circuit.
Interpretation: Higher current can reflect increased load, but interpretation requires equipment capacity, voltage, phase balance, and operating-state context.
Active Power
kW
The real power performing useful work at the time of measurement.
Interpretation: Use live and historical active power to understand demand behavior, load changes, and operating peaks.
Apparent Power
kVA
The combined effect of real and reactive power that determines the total electrical capacity carried by the system.
Interpretation: Compare apparent power with equipment and transformer capacity and interpret it alongside active power and power factor.
Power Factor
ratio
The ratio of active power to apparent power for the monitored load.
Interpretation: Values closer to 1 generally indicate more effective use of supplied apparent power. Investigate sustained deviation according to the site electrical policy.
Frequency
Hz
The measured alternating-current frequency of the electrical supply.
Interpretation: Review deviations against the local supply standard and equipment tolerance, particularly for generator operation or unstable sources.
Phase or Channel
identifier
The individual electrical phase, circuit, feeder, or meter channel associated with a reading.
Interpretation: Compare phases to identify imbalance, but verify that channel naming, scaling, and current-transformer orientation are configured correctly.
Minimum, Average, and Maximum
parameter unit
Summary statistics calculated for the selected measurement and reporting period.
Interpretation: Maximum values help locate peaks, averages show general behavior, and minimums can expose idle periods or outages. The sampling interval affects every statistic.
Grid Energy
kWh
Electrical energy imported from the utility grid over the selected reporting period, when a grid meter is integrated.
Interpretation: Confirm the meter boundary and import/export direction before using the value for billing, source mix, or emissions calculations.
Generator Energy
kWh
Electrical energy supplied by a connected generator over the selected period, when generator metering is available.
Interpretation: Compare generator energy with runtime, load, and approved fuel records; do not infer fuel efficiency from energy alone.
Generator Fuel
L
Fuel consumption or issued fuel associated with generator operation when an approved fuel source is integrated.
Interpretation: Distinguish measured consumption from manually entered or issued quantities and reconcile the same equipment and time boundary.
Data Freshness and Meter Health
status / timestamp
Connectivity, last-update time, and supported quality indicators for the meter, analyzer, or gateway.
Interpretation: Stale, offline, reset, or incorrectly scaled readings should not be treated as current evidence until the data source is validated.
Operational value
Expected outcomes
Shared energy visibility
Give facility, electrical, operations, and sustainability teams a common monitoring layer.
Faster anomaly investigation
Use phase, device, source, and historical context to investigate unexpected readings or consumption patterns.
Better source reconciliation
Compare available grid, generator, and fuel records within the same reporting period.
More consistent reporting
Use retained telemetry and exportable reports to reduce manual consolidation for approved operational and ESG workflows.
Shape this use case around your operations
Linked Things can assess available devices, telemetry, workflows, and reporting needs before defining a deployment approach.
Talk to our team