
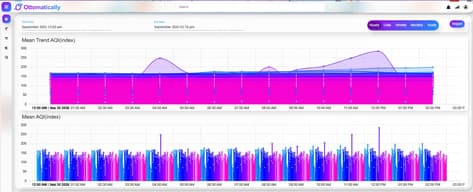
Air-quality and environmental readings are often distributed across stations, spreadsheets, and separate sensor portals. Without a shared geographic and historical view, teams can struggle to identify affected locations, distinguish short spikes from sustained exposure, verify data freshness, and investigate which pollutant or weather condition contributed to a changing AQI result.
Environmental Intelligence
Environmental & Air Quality Monitoring
Map monitoring stations, compare color-coded AQI conditions, analyze historical trends, and review available pollutant and weather measurements across locations.
Demo image
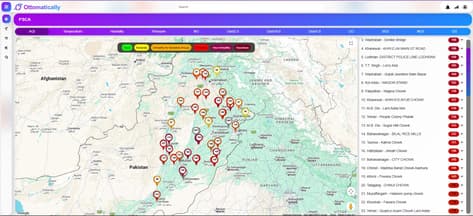
Monitoring-station map with color-coded AQI categories and location-level status.The problem
The solution
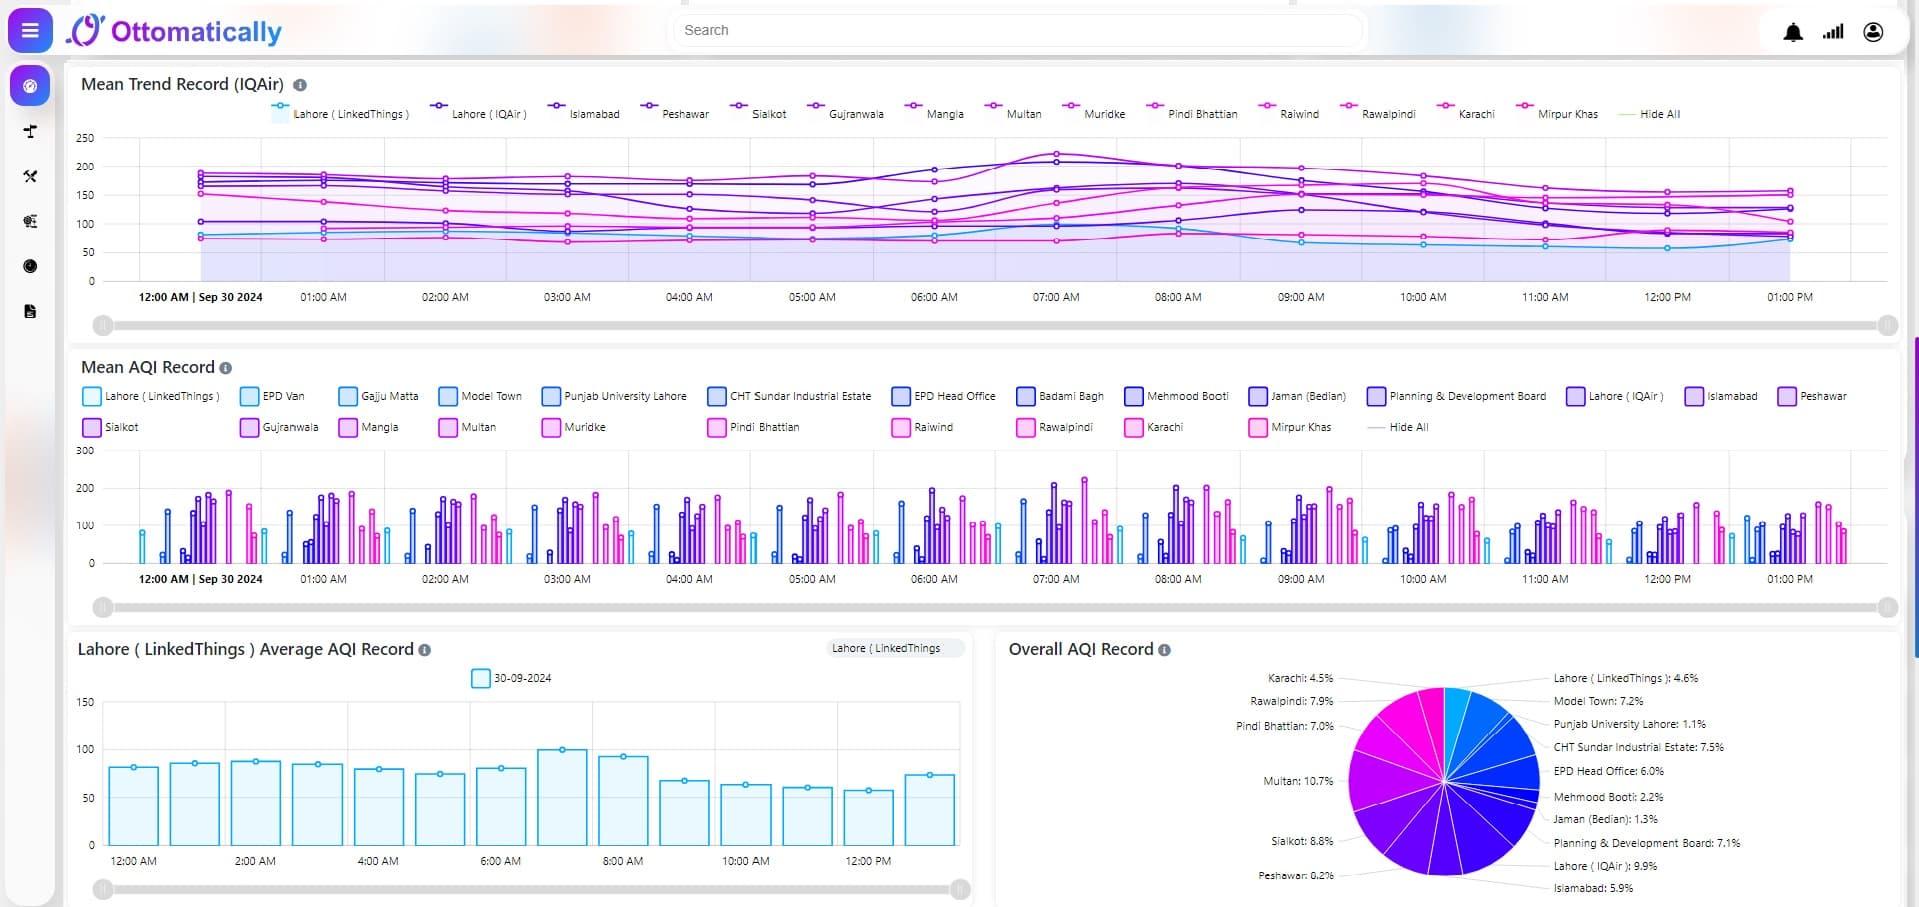
Linked Things brings available station telemetry into a location-aware dashboard with color-coded AQI markers, station lists, time-series trends, historical comparisons, and configurable thresholds. Depending on the installed sensors, the same monitoring layer can organize particulate matter, gases, temperature, humidity, pressure, wind, rainfall, device health, and data-freshness indicators for operational review.
What it enables
Key capabilities
Geographic station monitoring
View connected monitoring locations on a map with color-coded air-quality status and station-level readings.
AQI category visibility
Present index values using the configured Good-to-Hazardous category scale and applicable local standard.
Historical trend analysis
Compare mean and station-level AQI over hourly, daily, weekly, monthly, or selected reporting periods.
Pollutant and weather context
Review available particulate, gas, and meteorological measurements alongside the AQI result.
Threshold and anomaly alerts
Notify teams when configured readings, AQI categories, device conditions, or data gaps require review.
Station and data health
Track connectivity, reporting time, sensor availability, and other supported quality indicators.
Measurement guide
Parameters explained
Available measurements depend on the connected station, installed sensors, calibration, and configured reporting standard. Units and alert thresholds should be confirmed for each deployment.
Air Quality Index (AQI)
index
A communication index that converts one or more pollutant concentrations into an air-quality category. It is not a pollutant sensor reading by itself.
Interpretation: Higher values indicate poorer air quality. Category boundaries and the dominant pollutant depend on the configured national or organizational AQI standard.
PM1
µg/m³
Mass concentration of airborne particles with an aerodynamic diameter around 1 micrometre or smaller, when supported by the sensor.
Interpretation: Useful for understanding very fine particle behavior, but PM1 is not part of every regulatory AQI method and should not be treated as PM2.5.
PM2.5
µg/m³
Fine particulate matter with an aerodynamic diameter of 2.5 micrometres or smaller. It can originate from combustion, traffic, industry, smoke, and atmospheric formation.
Interpretation: Sustained higher concentrations generally represent greater health concern. Review the applicable averaging period and local standard before comparing thresholds.
PM10
µg/m³
Inhalable particulate matter with an aerodynamic diameter of 10 micrometres or smaller, including dust, road particles, construction material, and pollen-sized matter.
Interpretation: Short peaks may be influenced by dust or local activity. Compare values with PM2.5, weather, station location, and the required averaging period.
Carbon Monoxide (CO)
ppm or mg/m³
A colorless gas associated with incomplete combustion from vehicles, generators, heating, and industrial processes.
Interpretation: Elevated readings require prompt review of the source, ventilation, sensor range, and applicable exposure or ambient-air limit.
Carbon Dioxide (CO₂)
ppm
A gas commonly monitored indoors as an indicator of occupancy and ventilation effectiveness; it is not normally used as a conventional outdoor AQI pollutant.
Interpretation: Rising indoor levels can indicate insufficient ventilation relative to occupancy. Interpret outdoor and industrial measurements according to the monitoring objective.
Nitrogen Dioxide (NO₂)
ppb or µg/m³
A combustion-related gas often associated with traffic, boilers, generators, and industrial sources.
Interpretation: Examine elevated values with wind direction, traffic or operating schedules, averaging period, and the configured AQI standard.
Sulfur Dioxide (SO₂)
ppb or µg/m³
A gas associated with sulfur-containing fuel combustion and some industrial processes.
Interpretation: Short-duration peaks can matter. Verify sensor cross-sensitivity, nearby sources, wind conditions, and the applicable regulatory limit.
Ozone (O₃)
ppb or µg/m³
Ground-level ozone is a secondary pollutant formed through sunlight-driven reactions involving precursor emissions.
Interpretation: Levels may rise during sunny periods and downwind of emission sources. Interpret them with solar conditions, time of day, and the required averaging window.
Volatile Organic Compounds (TVOC)
ppb or mg/m³
A broad sensor estimate of volatile organic compounds from fuels, solvents, coatings, cleaning products, materials, and industrial activity.
Interpretation: TVOC is useful for detecting change but does not identify individual compounds. Source confirmation may require compound-specific instruments or laboratory analysis.
Temperature
°C
Ambient or indoor air temperature reported by the station.
Interpretation: Temperature provides operating and comfort context and can affect sensor response and pollutant chemistry; it is not itself an AQI pollutant.
Relative Humidity
%RH
The amount of water vapor in air relative to the maximum possible at the current temperature.
Interpretation: High humidity can influence optical particle readings and indoor comfort. Use compensated values where supported and review them with temperature.
Atmospheric Pressure
hPa
Local barometric pressure measured by the environmental station.
Interpretation: Pressure trends support weather context and sensor compensation but do not directly describe pollution severity.
Wind Speed and Direction
m/s and degrees
Meteorological measurements describing how fast the air is moving and the direction from which it arrives.
Interpretation: Use wind data to investigate dispersion and possible source direction; calm conditions can allow pollutants to accumulate near a station.
Rainfall
mm
Accumulated precipitation over the configured reporting interval, when a rain sensor is installed.
Interpretation: Rain can temporarily reduce airborne particles through washout and should be considered when explaining sudden changes in particulate trends.
Station Health and Data Freshness
status / timestamp
Operational indicators such as connectivity, last report time, sensor availability, battery or power state, and supported quality flags.
Interpretation: A stale, offline, warming-up, or faulted station should not be interpreted as current environmental evidence until data quality is confirmed.
Operational value
Expected outcomes
Faster hotspot identification
Use map markers and station comparisons to locate areas reporting elevated conditions.
Better trend interpretation
Separate isolated spikes from persistent patterns using historical and mean-value charts.
More focused investigation
Use pollutant, weather, station-health, and time context to guide follow-up activity.
Traceable reporting inputs
Retain measurement history for approved environmental, operational, ESG, or compliance workflows.
Shape this use case around your operations
Linked Things can assess available devices, telemetry, workflows, and reporting needs before defining a deployment approach.
Talk to our team