
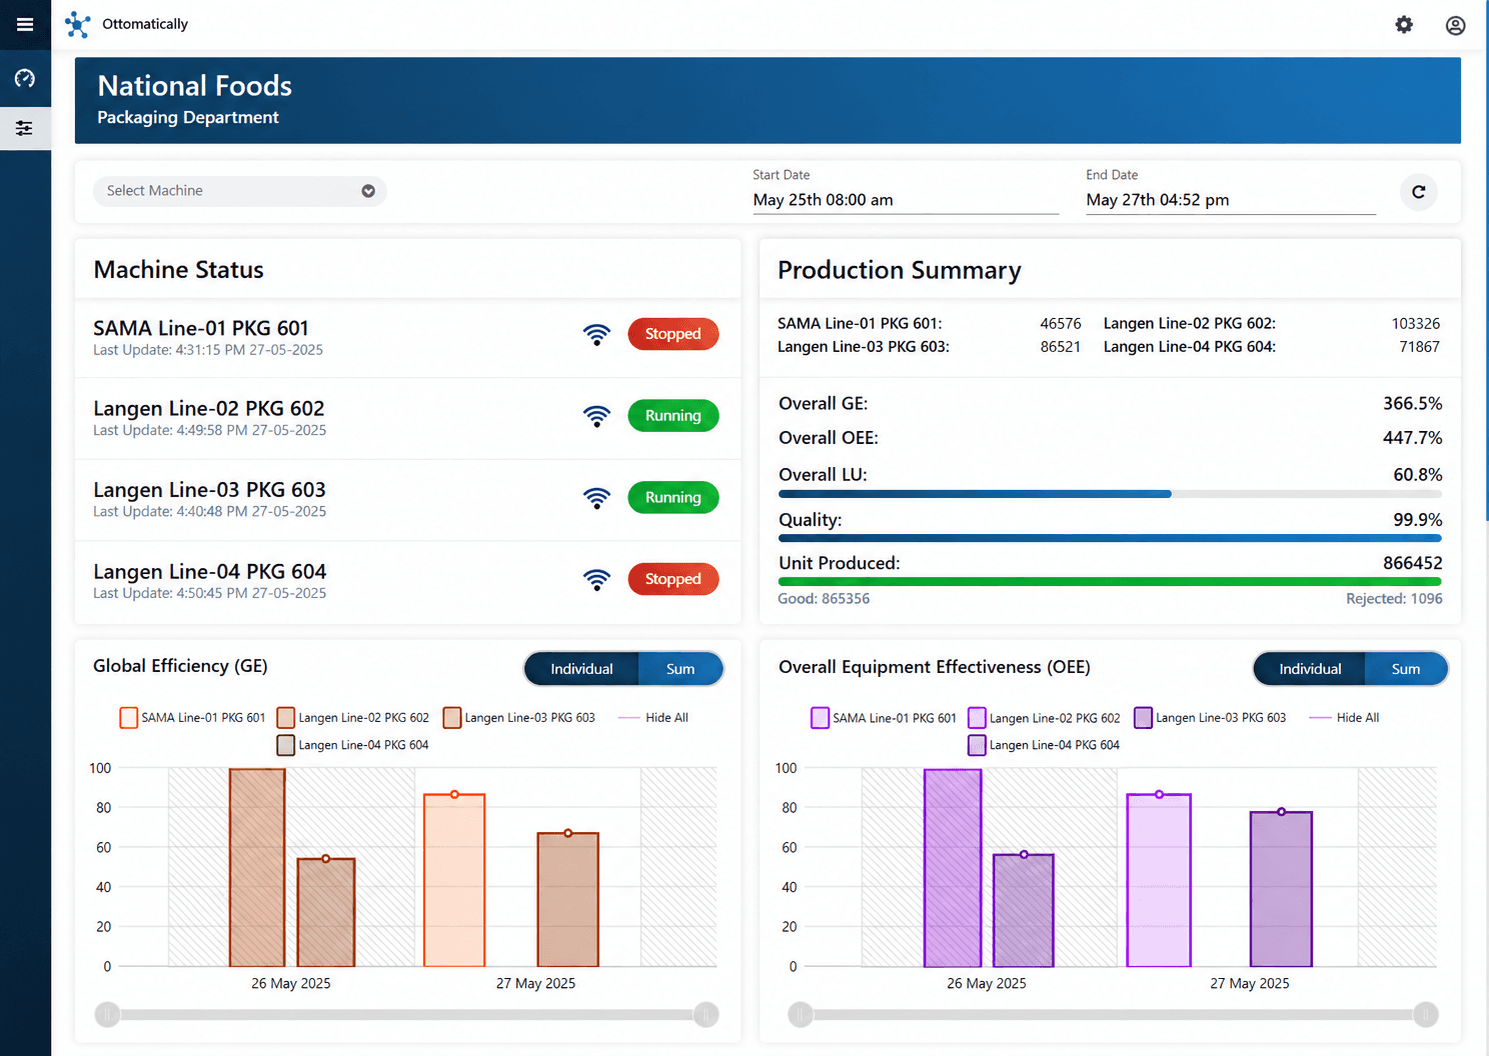
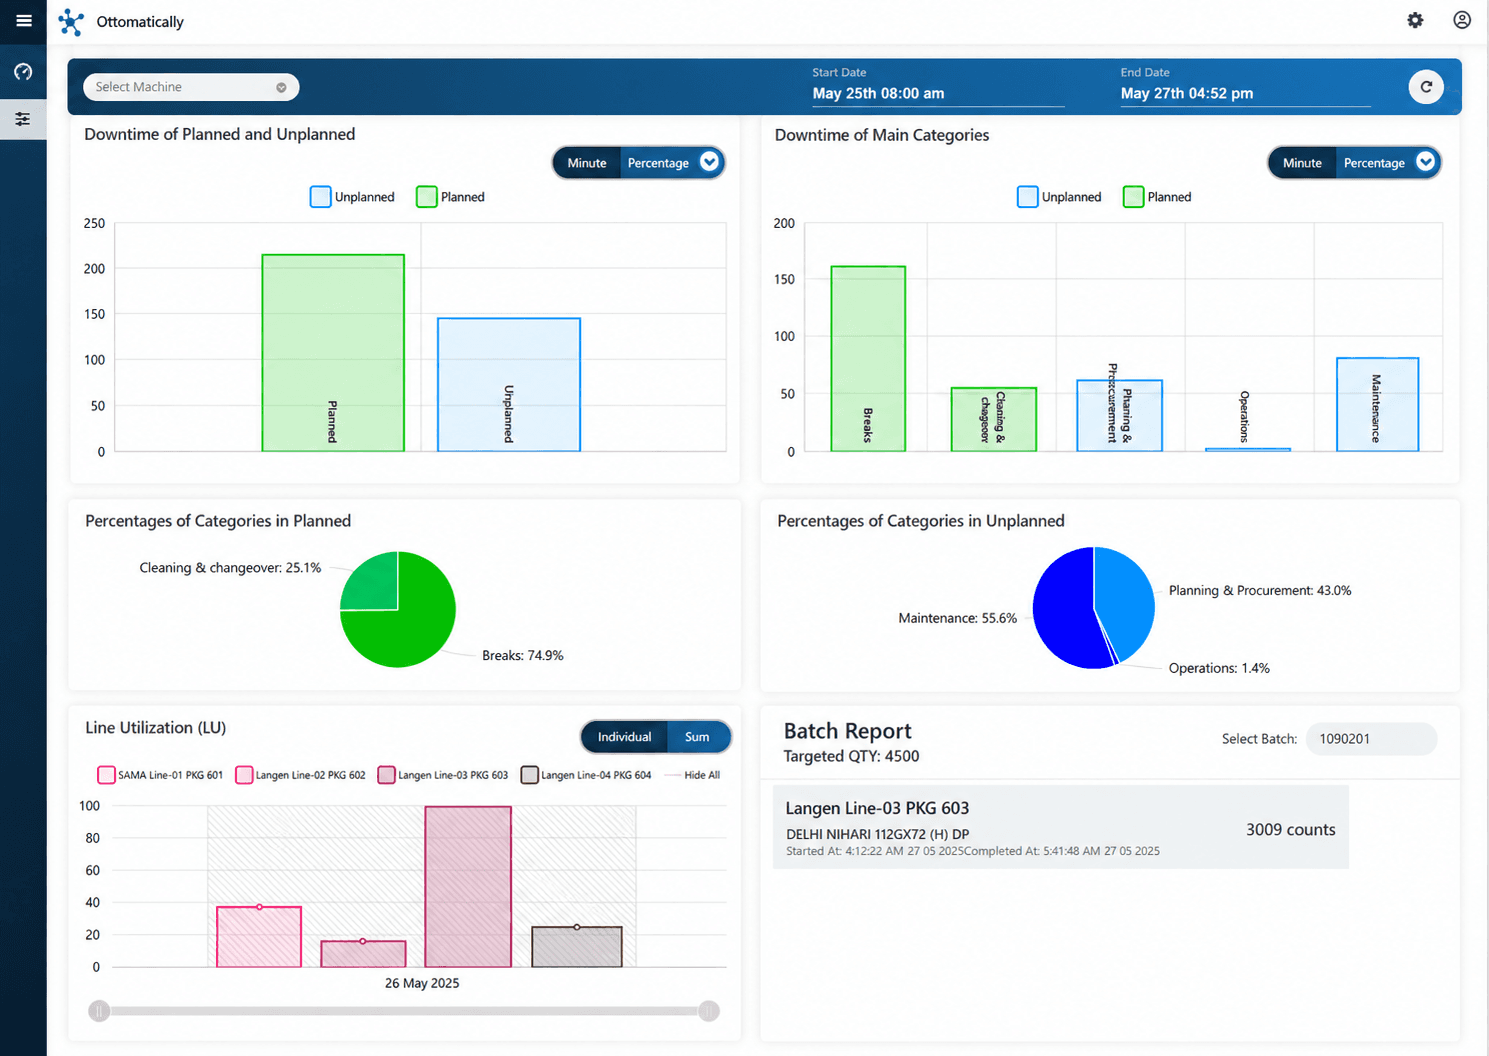
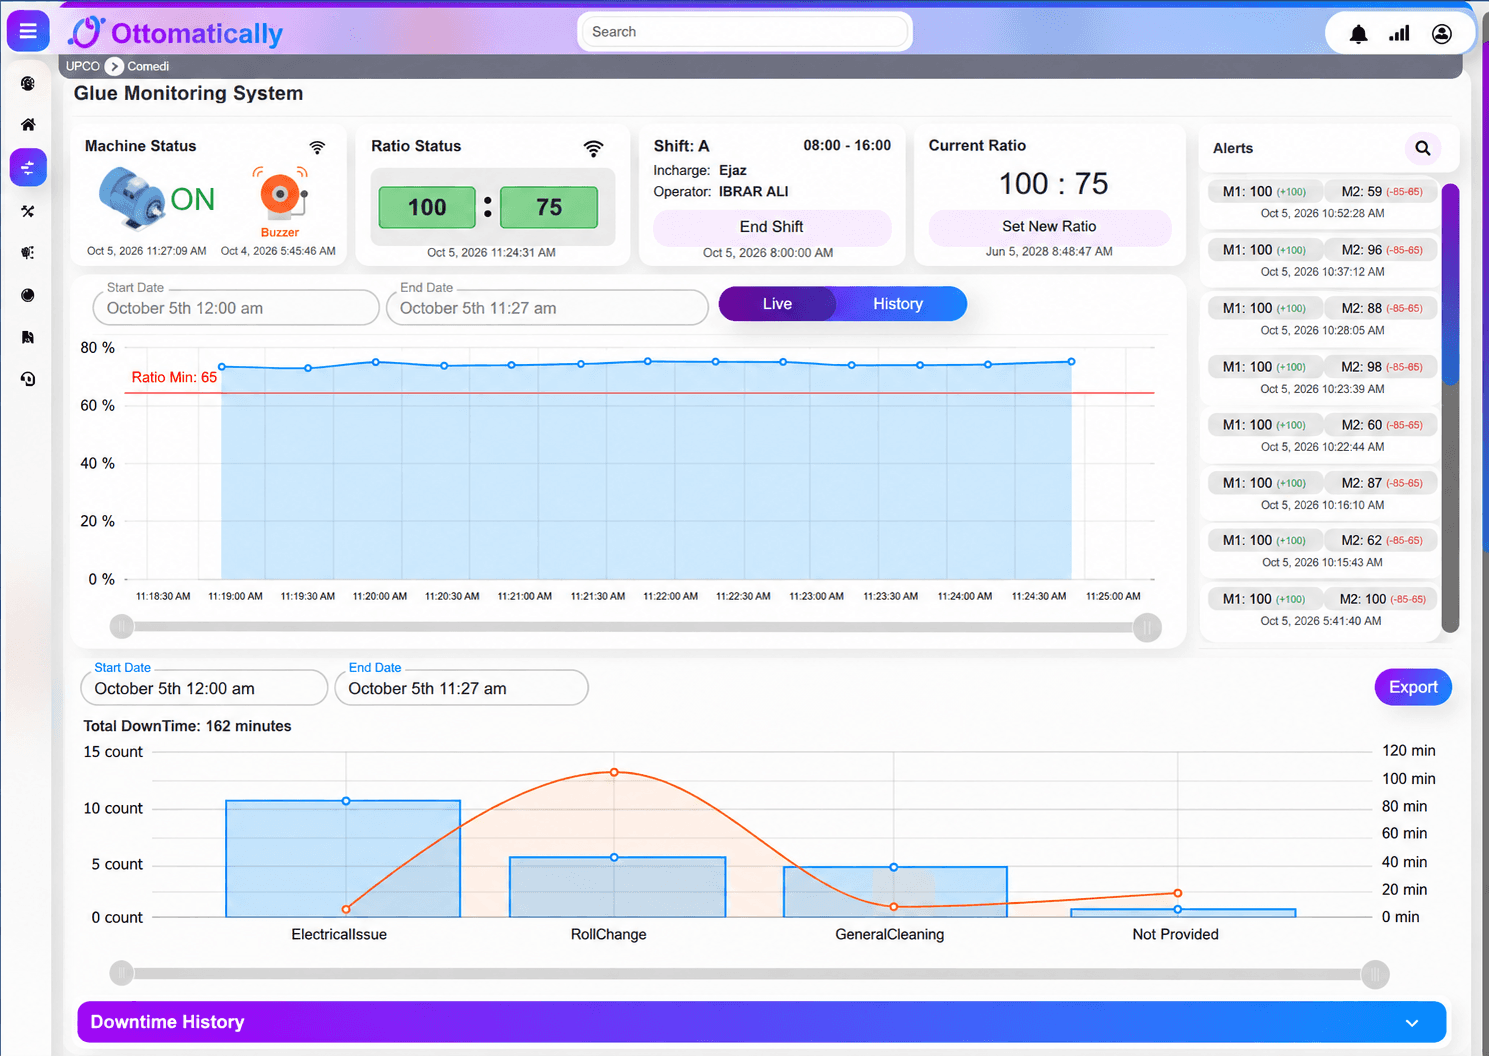
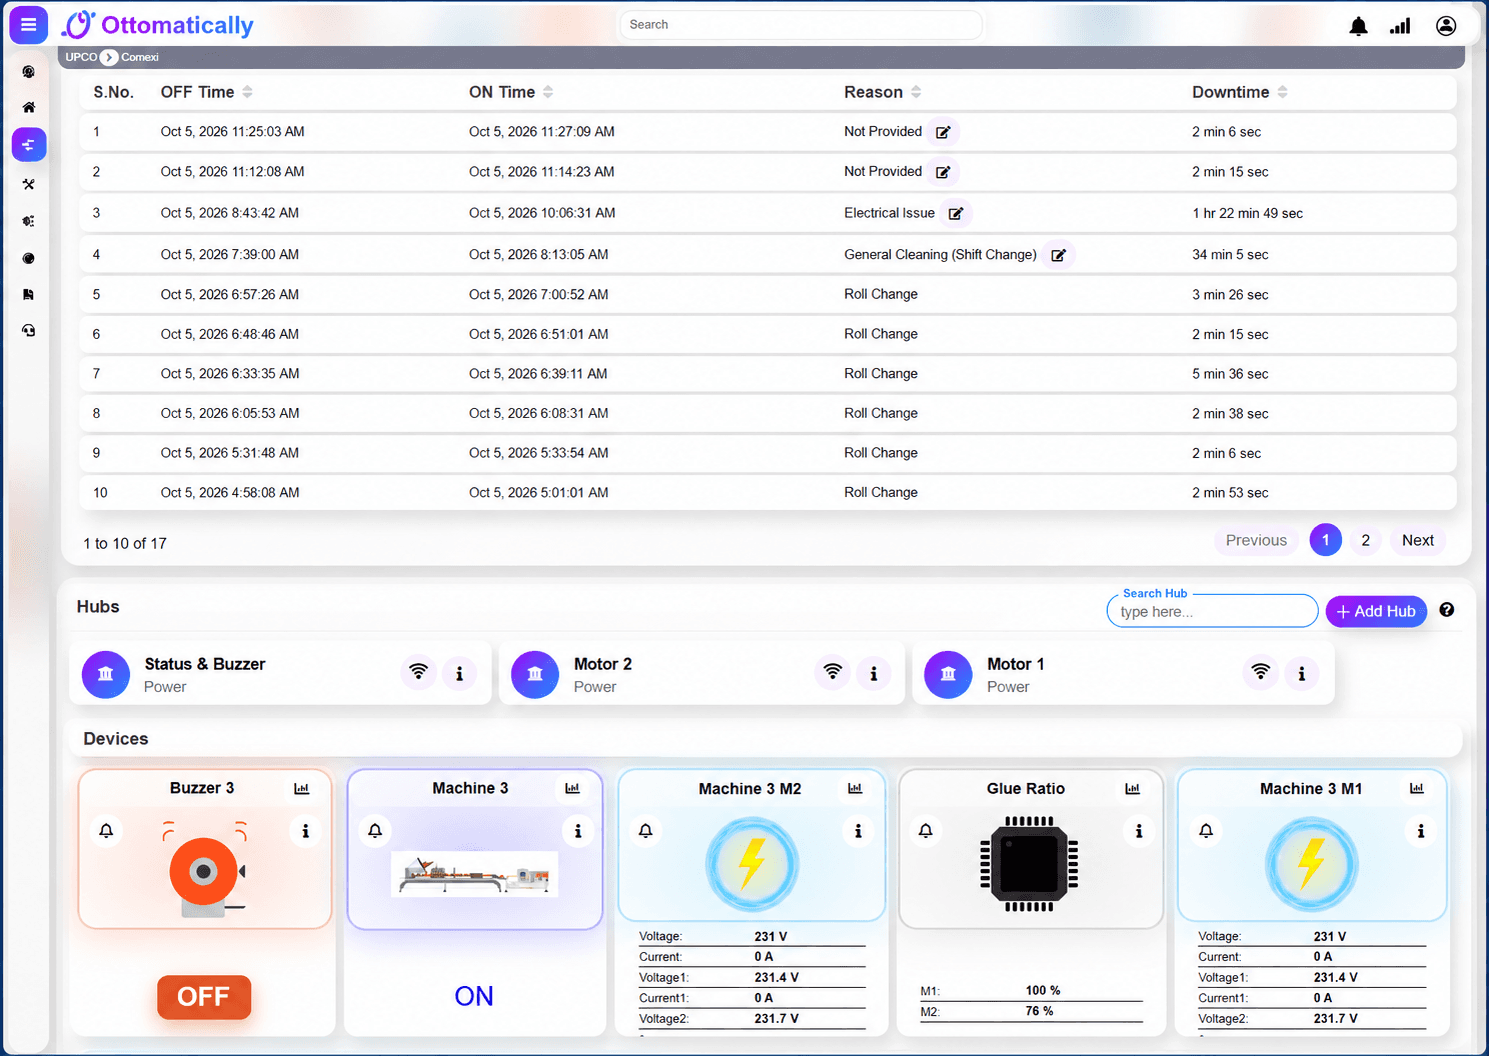
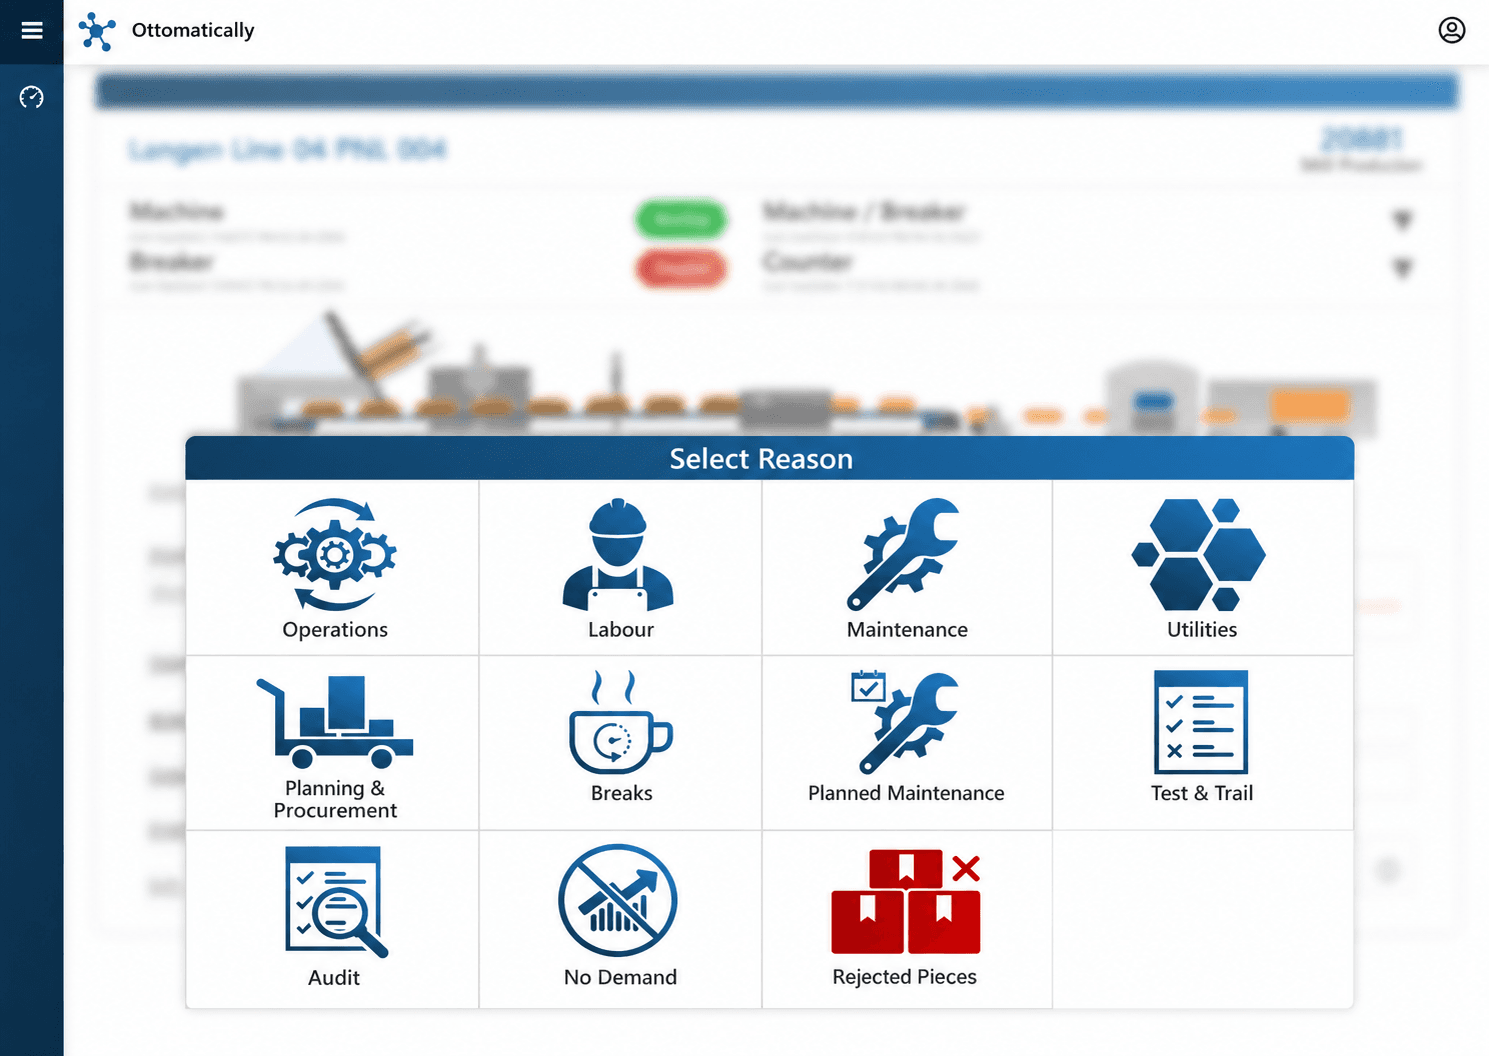
Production teams often rely on separate machine counters, shift sheets, operator notes, and maintenance records. This makes it difficult to see which lines are running, compare actual speed with the standard rate, reconcile good and rejected units, understand lost production time, assign consistent downtime reasons, and connect equipment conditions with batch performance.
Industrial Operations
Factory OEE & Downtime
Monitor production lines, OEE, line utilization, output quality, planned and unplanned downtime, batch progress, and equipment conditions in one operational view.
Demo image
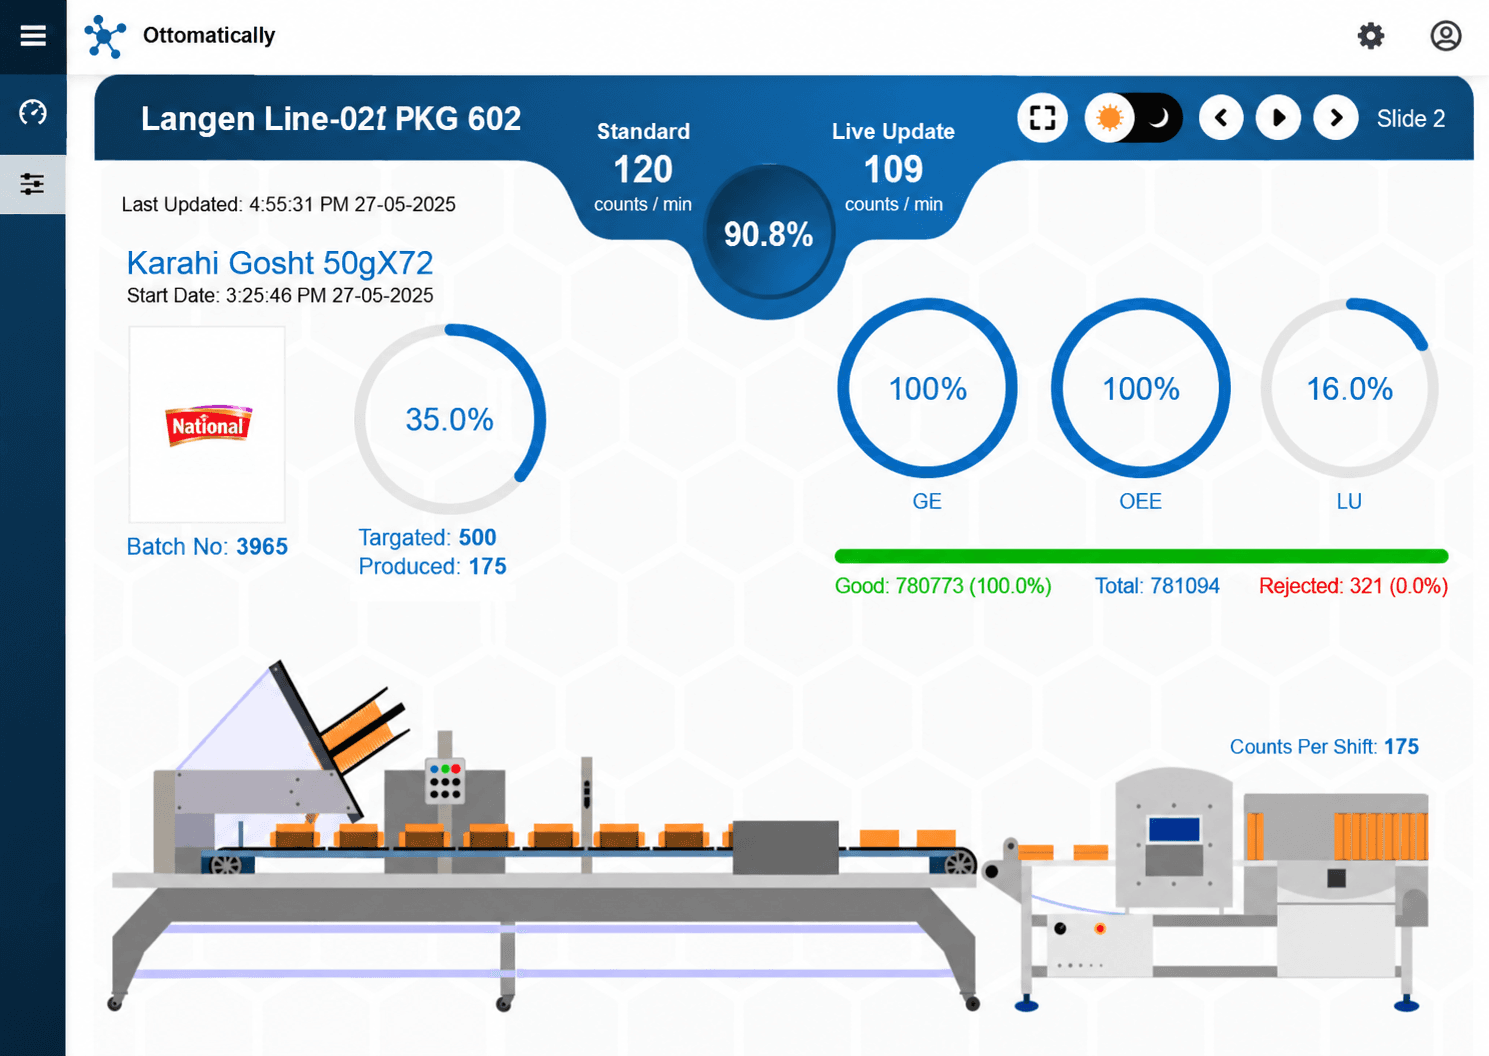
Demo line view with standard and live rate, target progress, OEE-related KPIs, utilization, and good/rejected counts.The problem
The solution
Linked Things can combine available PLC, counter, sensor, gateway, and operator-entered data in live and historical dashboards. Teams can monitor machine state, production rate, target progress, OEE-related KPIs, quality, utilization, downtime duration and frequency, reason categories, SKU and batch context, ratio processes, alerts, and supported electrical measurements from a shared interface.
What it enables
Key capabilities
Live line performance
Compare standard and current production rates while tracking target quantity, produced units, shift output, and batch progress.
OEE and utilization views
Review configured OEE, efficiency, quality, and line-utilization indicators by machine, line, and reporting period.
Production and quality accounting
Organize total, good, and rejected counts with product, SKU, batch, quantity, and speed context.
Machine-state monitoring
See running, stopped, connected, and last-updated status across available lines and connected equipment.
Downtime classification
Capture OFF and ON times, calculate duration, and classify events as planned or unplanned using consistent reason categories.
Loss and category analysis
Compare downtime minutes, occurrence counts, and category shares for maintenance, operations, cleaning, changeover, breaks, planning, and other configured reasons.
Process-ratio monitoring
Track configured material or glue ratios, minimum limits, live history, deviations, and associated alerts where ratio signals are connected.
Connected equipment context
Associate hubs and devices with supported readings such as motor state, voltage, current, connectivity, and alarms.
Measurement guide
Parameters explained
Available measurements depend on the connected station, installed sensors, calibration, and configured reporting standard. Units and alert thresholds should be confirmed for each deployment.
Overall Equipment Effectiveness (OEE)
%
A composite production KPI commonly calculated as Availability × Performance × Quality for a defined machine, line, and period.
Interpretation: A valid OEE should be between 0% and 100%. Confirm the configured formula, planned-production-time rules, and aggregation method before comparing machines or totals.
Availability
%
The proportion of planned production time during which the equipment was available to run.
Interpretation: Availability decreases when counted downtime occurs. Planned breaks or changeovers may be included or excluded according to the site calculation policy.
Performance / Global Efficiency (GE)
%
A configured comparison of actual output or operating rate against the expected rate. The dashboard may label the site-specific efficiency measure as GE.
Interpretation: Review the standard speed, runtime, counter source, and site formula. Values should not be compared across lines unless calculation rules are equivalent.
Quality
%
The share of total produced units accepted as good output, commonly calculated as Good Count ÷ Total Count × 100.
Interpretation: Quality decreases as rejected output increases. Confirm how rework, startup scrap, inspection loss, and counter corrections are handled.
Line Utilization (LU)
%
A site-configured measure of how much of the selected calendar or available time the production line was used.
Interpretation: LU is not automatically the same as OEE Availability. The denominator may include non-production time, so the site definition must be documented.
Standard and Live Production Rate
counts/min
The expected production speed for the configured SKU compared with the current measured counter rate.
Interpretation: A live rate below the standard may indicate minor stops, reduced speed, material constraints, or counter timing effects; investigate with machine state and downtime history.
Target, Produced, and Progress
count and %
The planned batch or shift quantity, the measured produced quantity, and progress toward the target.
Interpretation: Verify batch start and end boundaries, counter resets, rejected-unit treatment, and any manual quantity corrections.
Good, Rejected, and Total Count
count
Production counters separating accepted output from rejected output and the combined or source total.
Interpretation: The relationship between counters depends on the configured sensors and business rules; reconcile them with quality inspection and rework processes.
Machine State
status
A derived or reported state such as Running, Stopped, ON, or OFF, with connectivity and last-update context where available.
Interpretation: A stale timestamp or lost connection should not be treated as a confirmed machine stop. Review data freshness and source signal logic.
Downtime Duration and Frequency
seconds/minutes and count
Elapsed time between an OFF event and the corresponding ON event, plus the number of events in each reason category.
Interpretation: Use duration to identify major time losses and frequency to identify recurring short stops. Both views are needed for prioritization.
Planned and Unplanned Downtime
minutes or %
Planned events are expected activities such as breaks, cleaning, changeover, or scheduled maintenance; unplanned events are unexpected losses such as faults or operational interruptions.
Interpretation: Classification depends on the approved reason taxonomy. Audit uncategorized events and avoid changing definitions between reporting periods.
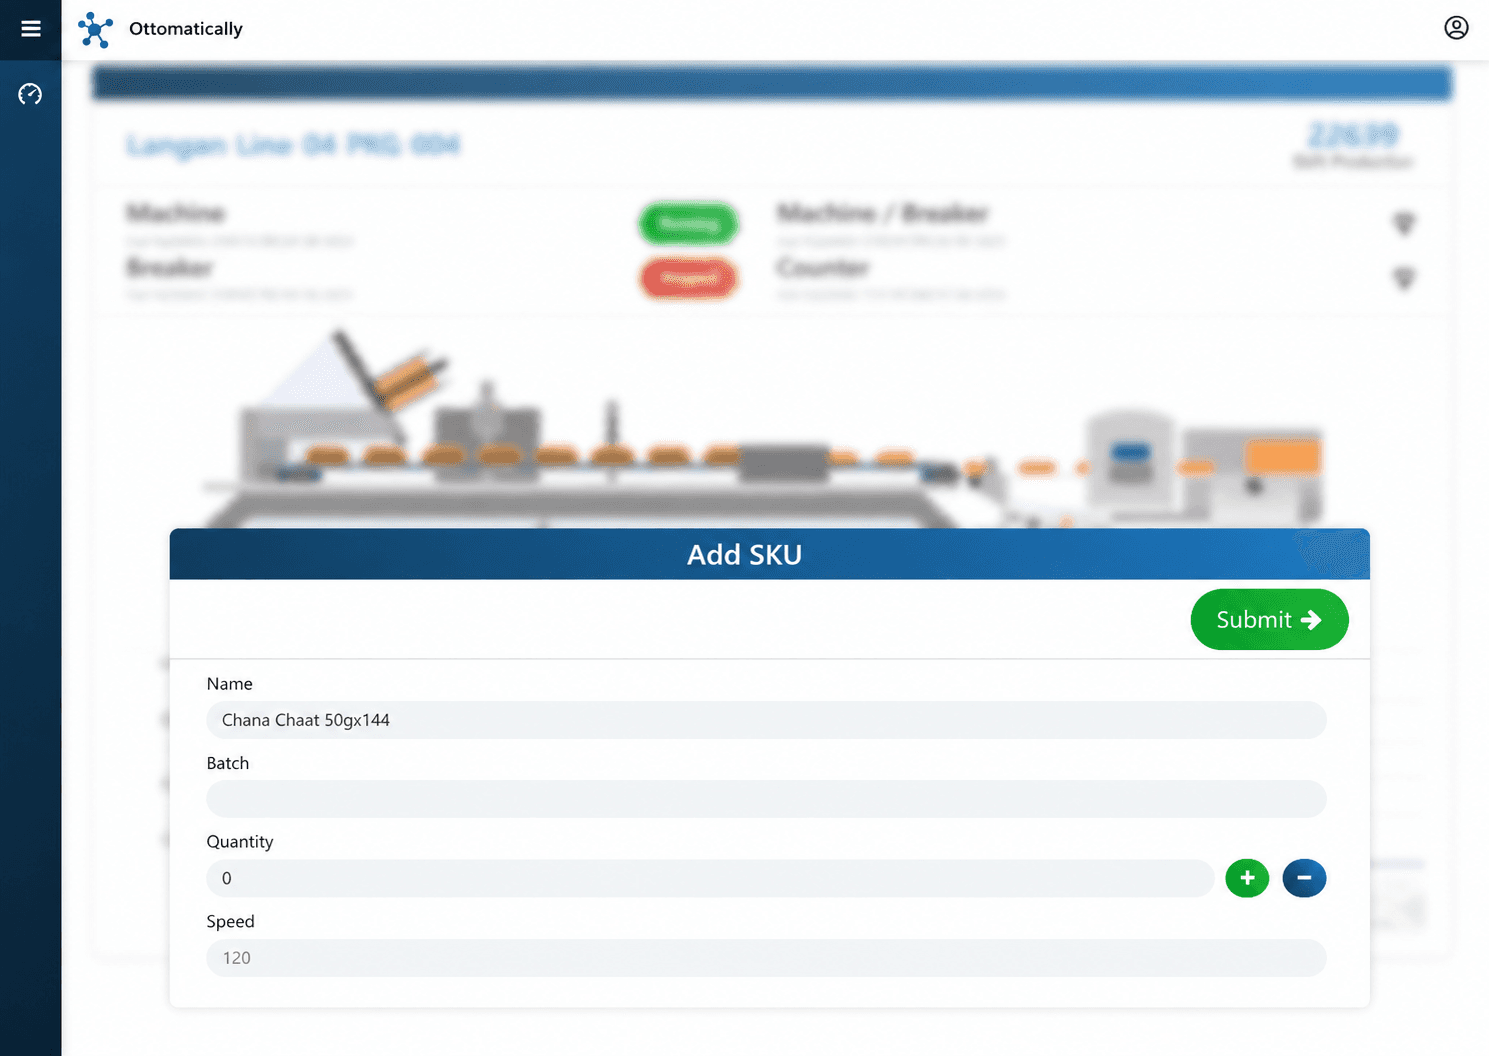
SKU, Batch, Quantity, and Speed
configured values
Production context used to associate a product and batch with the target quantity and standard operating speed.
Interpretation: Accurate setup is essential because the selected SKU and speed influence target progress and performance calculations.
Process or Glue Ratio
ratio or %
The configured relationship between two material or process signals, shown with current values, trend history, and a minimum or target limit where supported.
Interpretation: A ratio alert indicates deviation from the configured operating rule; confirm sensor calibration, material flow, and the approved recipe before intervention.
Electrical and Device Signals
V, A, status
Available device context such as voltage, current, motor state, buzzer state, connectivity, and hub association.
Interpretation: These signals support diagnosis but do not independently prove root cause. Observe electrical-safety procedures and validate anomalies with qualified personnel.
Operational value
Expected outcomes
Faster loss investigation
Give production and maintenance teams a shared event timeline with machine, batch, reason, and duration context.
More consistent downtime records
Replace free-text explanations with controlled reason categories while retaining the ability to review and correct events.
Clearer shift and line comparison
Compare rates, production, quality, utilization, and losses across connected lines and selected reporting periods.
Evidence for improvement work
Use historical production and downtime patterns to prioritize maintenance, changeover, planning, and process follow-up.
Shape this use case around your operations
Linked Things can assess available devices, telemetry, workflows, and reporting needs before defining a deployment approach.
Talk to our team